As of 9:00 a.m. Eastern Time on July 22, 2026, Brent crude, the world’s main oil benchmark, is trading at $92.21 per barrel. That is up $1.20 from the previous session’s close and roughly $23.70 higher than the price one year ago. West Texas Intermediate (WTI), the primary North American benchmark, is trading at $85.42 per barrel, up about $1.08 from yesterday.
| Oil price per barrel | Brent | % Change | WTI | % Change |
| Today | $92.21 | +1.32% | $85.42 | +1.29% |
| Yesterday | $91.01 | $84.34 | ||
| 1 month ago | $77.09 | +19.63% | $73.22 | +16.68% |
| 1 year ago | $68.50 | +34.60% | $65.25 | +30.92% |
Both benchmarks have climbed for four straight sessions and now sit near six week highs. The move is not a fluke of trading. It reflects a genuine supply scare that has been building across several regions at once, and it is worth walking through in detail before we get into how oil pricing works, how it feeds into what you pay at the pump, and what history tells us about where prices tend to go from here.
Why oil prices are climbing right now
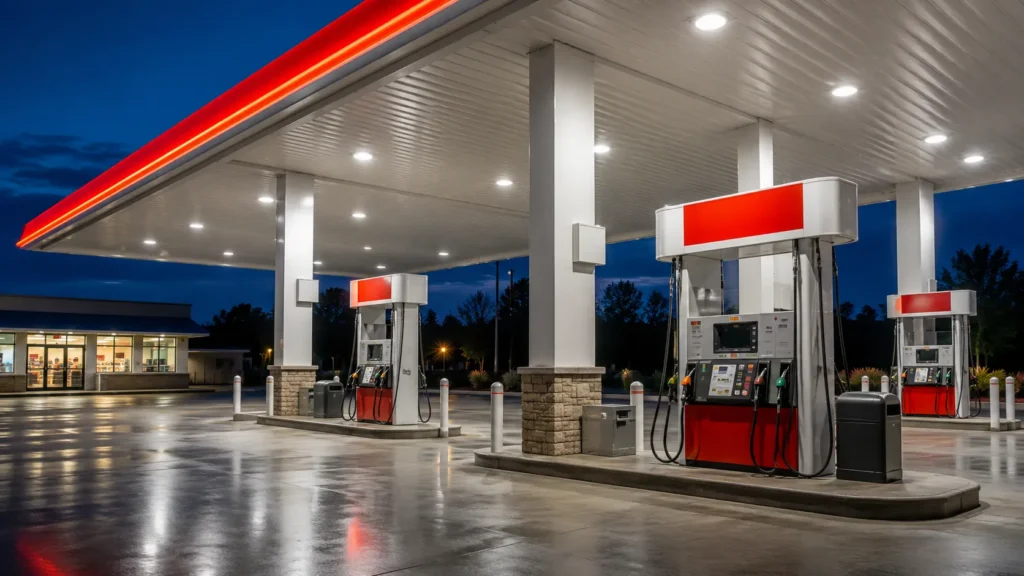
The single biggest driver of the current rally is the ongoing conflict between the United States and Iran, which has now stretched past a week and a half of near daily strikes. Washington has carried out more than ten consecutive days of military action against Iranian targets, and President Trump has said additional strikes are possible if the conflict widens. Iran has responded with missile and drone attacks, including strikes on a power and desalination plant in Kuwait, and has repeatedly targeted commercial tankers attempting to transit the Strait of Hormuz.
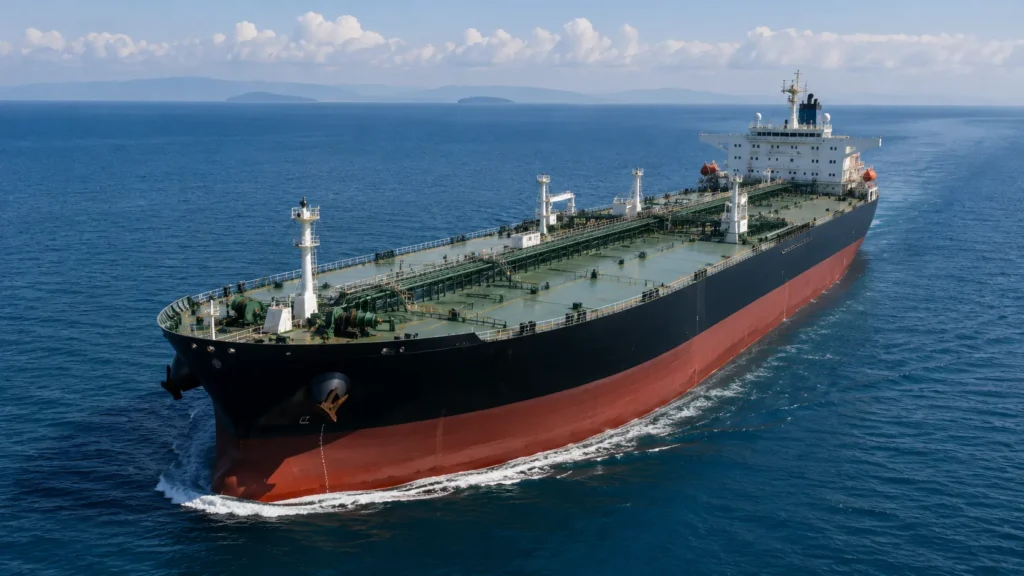
The Strait of Hormuz matters enormously to the oil market because roughly a fifth of global oil consumption passes through that narrow waterway between Iran and Oman. Even the threat of a partial blockage is enough to send traders scrambling, because there is no easy substitute route for that much crude. A Kuwaiti tanker carrying oil products was struck near the strait this week, which is exactly the kind of headline that keeps a risk premium baked into the price.
Saudi Arabia has been rerouting a portion of its exports through pipelines and the Red Sea to reduce its reliance on Hormuz, but that workaround has its own vulnerabilities. Yemen’s Houthi movement, which is backed by Iran, has threatened to block Saudi maritime traffic in the Red Sea, and at least one Saudi tanker has already reversed course rather than risk the passage. President Trump has warned of retaliation if the Houthis follow through on disrupting that corridor.
The unrest is not confined to the Middle East. Attacks on the Caspian Pipeline Consortium terminal on Russia’s Black Sea coast have disrupted a key export route for Kazakhstan, one of the largest crude producers outside OPEC. When multiple choke points face pressure simultaneously, the market tends to price in worst case scenarios rather than average ones, which helps explain why Brent has jumped nearly 20% in the past month alone.
There have also been intermittent signs of de-escalation. Iran has confirmed receiving mediation proposals, and reports have circulated about a possible ten day ceasefire. Markets have responded to that kind of news with brief pullbacks, only to resume climbing once fighting picks back up. That back and forth is a useful reminder that oil prices during an active conflict rarely move in a straight line.
Brent vs. WTI: the two benchmarks that set the world’s oil price
Anyone reading oil price coverage will run into two names constantly: Brent and West Texas Intermediate. Understanding the difference helps make sense of why the numbers you see in different headlines are not always identical.
Brent crude is extracted from fields in the North Sea and functions as the primary benchmark for oil produced in Europe, Africa, and much of the Middle East. Because it prices such a large share of internationally traded crude, Brent is generally treated as the global standard. The U.S. Energy Information Administration itself now uses Brent as the primary reference point in its Annual Energy Outlook, which tells you how central this benchmark has become even for American policy analysis.
West Texas Intermediate is the benchmark for crude produced in the United States, primarily out of Texas and the broader Permian Basin. WTI is a lighter, sweeter crude than Brent, meaning it has lower density and less sulfur, which makes it somewhat cheaper to refine. Historically WTI traded at a premium to Brent, but the shale boom of the past decade and a half flipped that relationship, and WTI now typically trades a few dollars below Brent, as it is again today.
Both benchmarks respond to the same broad forces, supply, demand, geopolitics, and the value of the U.S. dollar, but they can diverge over short stretches depending on regional bottlenecks, refinery outages, or pipeline capacity. When a story is specifically about U.S. gas prices, WTI tends to be the more relevant number. When the story is about the global oil market as a whole, Brent is usually the better reference.
How oil prices translate into what you pay at the pump
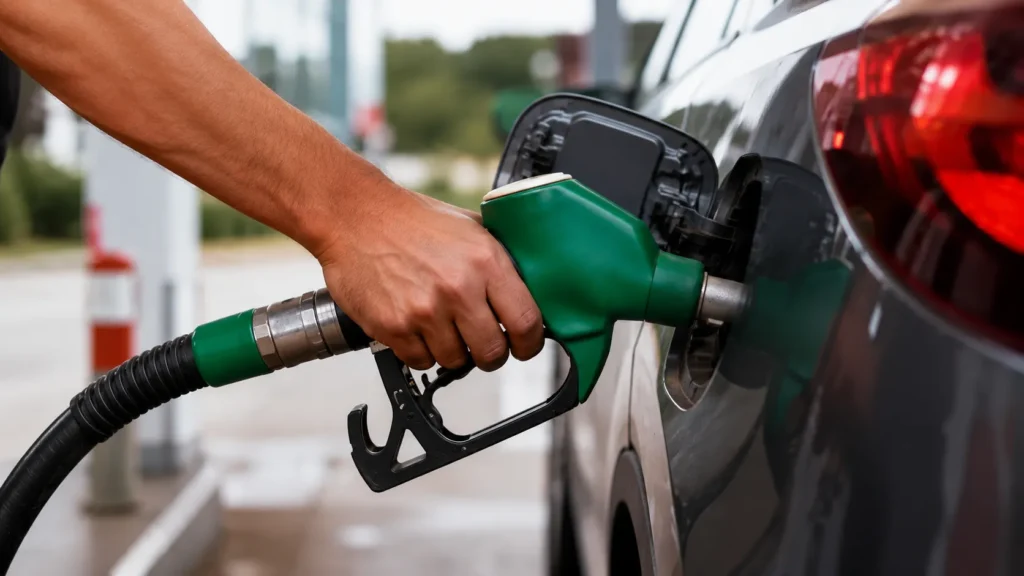
The price of crude oil is the single largest input into the price of a gallon of gasoline, but it is far from the only one. Once crude leaves the ground, it has to be refined into gasoline, transported to a regional terminal, distributed to a local station, and marked up enough to cover the station’s own costs and profit margin. Federal and state taxes are layered on top of all of that, and those taxes vary widely depending on where you live.
Because crude typically accounts for more than half the retail price of a gallon of gas, big swings in oil prices tend to show up at the pump fairly quickly, though rarely instantly. When oil prices spike, retail gas prices usually follow within a couple of weeks as stations work through existing inventory before repricing. When oil prices fall, however, gas prices tend to come down more slowly. Industry watchers call this pattern “rockets and feathers,” a description of how prices rocket upward but drift down like a feather. Part of the reason is that stations are often reluctant to cut prices faster than their competitors, and part of it is simply that existing supply purchased at the higher price still needs to be sold through.
Given the current run up in Brent and WTI, drivers should expect gas prices to keep climbing over the next several weeks if the underlying conflict does not ease. Some regions have already reported gas prices snapping back toward the $4 per gallon mark as the geopolitical situation has worsened.
The role of the U.S. Strategic Petroleum Reserve
The United States maintains an emergency stockpile of crude oil known as the Strategic Petroleum Reserve, housed in underground salt caverns along the Gulf Coast. It exists primarily as an energy security backstop, something the government can draw on during a genuine supply disruption caused by war, sanctions, a major storm, or some other shock that takes a meaningful volume of oil off the market unexpectedly.
Releases from the reserve are not designed to be a long term fix for high prices. They are meant to provide short term relief, buying time for markets to adjust, for alternative supply to come online, or for a crisis to resolve, while keeping essential sectors like emergency services, public transportation, and critical manufacturing running without severe disruption. Given the current tension around the Strait of Hormuz, a release from the reserve is one of the tools policymakers could reach for if the situation escalates further, though it is typically used as a last resort rather than a first response.
How oil and natural gas prices move together
Oil and natural gas are both primary energy sources, and because they are used for overlapping purposes, especially in industrial heating, power generation, and manufacturing, changes in one commodity’s price often ripple into the other. When oil prices rise sharply, some industrial users that have the flexibility to run on either fuel will shift toward natural gas, which increases demand for gas and can push its price higher as well.
That relationship is not perfectly consistent. Natural gas has its own supply dynamics, including storage levels, weather driven demand for heating and cooling, and a growing export market tied to liquefied natural gas shipments. Interestingly, natural gas prices have actually fallen over the past month even as oil has surged, a reminder that the two commodities can decouple for stretches of time even though they are broadly connected over the long run.
Historical performance of oil: a market defined by shocks
If there is one lesson from the history of oil prices, it is that stability is the exception, not the rule. Two benchmarks are typically used to study long run performance, Brent and WTI, with Brent generally considered the better gauge of the global market because it reflects such a large share of internationally traded crude.
Looking back across the decades, oil’s price history reads almost like a chronicle of geopolitical and economic upheaval:
The early 1970s brought the first major oil shock, when Middle Eastern producers cut exports and imposed an embargo on the United States and other nations during the Yom Kippur War, sending prices sharply higher and reshaping energy policy for a generation.
The mid-1980s saw prices collapse as demand softened and a wave of non-OPEC producers entered the market, breaking OPEC’s pricing power for years afterward.
Prices climbed to record highs in 2008, driven by surging global demand, only to crash within months as the global financial crisis gutted economic activity worldwide. Brent’s all time high of $147.50 per barrel was set in July 2008, a level it has not approached since despite the current rally.
The COVID-19 lockdowns of 2020 produced perhaps the strangest episode in oil market history, when demand evaporated so completely that U.S. crude futures briefly traded at a negative price, an event essentially unprecedented in the modern era, before prices recovered as economies reopened.
The current run up, driven by direct military conflict between the United States and Iran and threats to some of the world’s most important shipping corridors, fits the historical pattern of sharp, geopolitically driven spikes. What history also shows is that these spikes rarely hold indefinitely. Prices tend to retreat once the underlying shock passes, supply adjusts, or demand responds to higher costs, though the timeline for that adjustment can range from months to years depending on how deep the disruption runs.
OPEC+ and the question of spare capacity
No discussion of oil prices is complete without OPEC+, the alliance of the Organization of the Petroleum Exporting Countries and a group of allied producers including Russia. OPEC+ controls a large enough share of global production that its decisions on output quotas can move prices meaningfully in either direction.
During periods of geopolitical stress like the current one, attention turns quickly to how much spare capacity OPEC+ members, particularly Saudi Arabia and the United Arab Emirates, can bring online to offset lost supply elsewhere. Spare capacity acts as a kind of shock absorber for the market. When it is abundant, supply disruptions matter less because producers can ramp up quickly to fill the gap. When spare capacity is thin, even a modest disruption can send prices sharply higher because there is little buffer left.
Saudi Arabia’s decision to reroute exports through the Red Sea and pipeline infrastructure, rather than relying solely on the Strait of Hormuz, is itself a form of capacity management, an attempt to keep barrels flowing even if the strait becomes less reliable. How OPEC+ as a whole responds in the coming weeks, whether by raising output quotas to cool prices or holding steady to support producer revenues, will be one of the more important variables to watch alongside the military situation itself.
Ways everyday investors track and gain exposure to oil prices
For readers who follow oil prices beyond the pump, there are several common ways exposure to crude shows up in a typical portfolio. Futures contracts, traded on exchanges like the New York Mercantile Exchange, are the instruments that actually set the benchmark Brent and WTI prices referenced throughout this article, though futures trading is generally the domain of institutional traders and experienced individual investors given the leverage and volatility involved.
Exchange traded funds offer a more accessible route. Broad energy sector ETFs hold shares of oil and gas producers, refiners, and service companies, meaning their performance is tied to corporate profitability rather than the spot price of crude directly. Commodity focused ETFs attempt to track the price of oil more directly by holding futures contracts, though they can diverge from spot prices over time due to the mechanics of rolling contracts forward as they expire.
Individual energy stocks are another common entry point. Integrated majors like Exxon Mobil tend to be somewhat less volatile than pure exploration and production companies, because their refining and chemical operations can partially offset swings in crude prices. Smaller shale focused producers, by contrast, tend to move more sharply with the price of WTI given their concentrated exposure to U.S. production economics.
None of this should be read as a recommendation to buy or sell any particular investment. Energy markets are volatile even in calm periods, and the current geopolitical backdrop adds a layer of risk that is difficult to quantify. Anyone considering exposure to oil markets, whether through futures, ETFs, or individual stocks, should think carefully about their own risk tolerance and consider speaking with a licensed financial advisor before making decisions.
Why gas prices vary so much from state to state
Even though every driver is ultimately paying for the same barrel of crude, the price at the pump can differ by more than a dollar a gallon depending on where you live. State and local taxes explain a large part of that gap. Some states layer on relatively modest fuel taxes, while others, particularly on the West Coast, add substantial excise taxes and additional environmental compliance costs tied to cleaner burning fuel blends required by state regulators.
Distance from refining capacity plays a role as well. States near the Gulf Coast, home to a large share of the country’s refining capacity, tend to see somewhat lower prices simply because fuel does not have to travel as far. States at the end of long supply chains, including much of the West Coast and parts of the Northeast, typically pay a premium to cover the added transportation and logistics costs.
Local market competition matters too. Areas with more gas stations competing for the same drivers tend to see prices held closer to the underlying cost of fuel, while regions with fewer options can see wider margins. All of these local factors sit on top of the national trend driven by crude prices, which is why a national average, however useful as a benchmark, rarely matches what any individual driver actually pays.
What could change the trajectory from here
A few developments could meaningfully alter where oil prices head over the coming weeks. A genuine, lasting ceasefire between the United States and Iran would likely take much of the current risk premium out of the market fairly quickly, since a large part of the recent run up reflects fear of disruption rather than an actual, sustained loss of supply. Traders have already shown they will pull prices back on ceasefire headlines, only for prices to climb again once fighting resumes, so the durability of any truce will matter more than the announcement itself.
On the other hand, an actual closure or extended blockage of the Strait of Hormuz, even a partial one, would likely push prices considerably higher than where they sit today, given how much of the world’s crude passes through that single corridor. Similarly, if the Houthi threat to Red Sea shipping escalates into sustained attacks rather than isolated incidents, Saudi Arabia’s workaround routes would become less reliable, removing one of the market’s few current pressure release valves.
Beyond the Middle East, global demand trends are worth watching as well. Slower economic growth in major consumers like China would tend to soften prices even amid supply worries, while a stronger than expected recovery in demand from aviation, shipping, or manufacturing could add further upward pressure on top of the current geopolitical premium. OPEC+ production decisions at upcoming meetings will also factor heavily into the outlook, since the group retains the ability to open the taps further if members judge that prices have risen further than the fundamentals justify.

Frequently asked questions
How is the current price of oil per barrel actually determined?
Oil prices are set primarily through futures markets, where traders buy and sell contracts for delivery of crude oil at a future date. The most actively traded contracts, for Brent and WTI, serve as the reference prices you see quoted in the news. These prices reflect the market’s collective expectation of supply and demand balance, adjusted continuously as new information, everything from OPEC+ decisions to geopolitical events to economic data, becomes available.
How often does the price of oil change during the day?
Oil futures trade nearly around the clock on exchanges around the world, so prices can change by the second during active trading hours. The headline numbers reported in daily coverage, including the figures at the top of this article, typically represent a snapshot taken at a specific time, which is why the same commodity can show slightly different prices depending on when and where you check.
How does U.S. shale oil production affect the current price of oil?
Shale production transformed the United States from a major oil importer into one of the world’s largest producers over the past fifteen years, and that shift has structurally changed how the global market responds to price signals. Because shale wells can be brought online or shut in relatively quickly compared to conventional projects, U.S. production tends to act as a flexible supply source that can respond to price changes faster than traditional producers, which has historically helped cap the upside during periods of tight supply. That flexibility has, however, been tested by the current conflict, since geopolitical risk premiums can outpace the speed at which new shale supply can actually reach the market.
How does the current price of oil impact inflation and the broader economy?
Energy costs feed into the price of nearly everything, from the diesel that powers freight trucks to the natural gas used in manufacturing to the gasoline consumers buy directly. When oil prices rise sharply and stay elevated, that pressure tends to show up in broader inflation measures within a few months, and it can also weigh on economic growth by leaving households and businesses with less money to spend elsewhere after covering higher energy bills. Central banks watch oil prices closely for exactly this reason, since a sustained spike can complicate decisions about interest rates even when the rest of the economy looks otherwise stable.
A note on this article
Oil prices referenced above reflect market conditions as of the morning of July 22, 2026, and will change, likely by the time you finish reading this. This article is intended for general informational purposes and should not be treated as financial or investment advice. Maxi Journal is not a registered investment advisor, and readers should consult a qualified financial professional before making decisions based on commodity price movements.
If you want more approachable technology and business analysis like this, explore maxijournal.com for practical articles that translate complex topics into clear, useful guidance.
Discover more from Maxi Journal
Subscribe to get the latest posts sent to your email.