A fast robot runtime can hide a slow, expensive process. Work moves quickly through the automated steps, then sits in an exception queue, waits for an approver, or comes back for corrections. That’s why workflow automation benefits shouldn’t be judged by headline speed alone.
The useful question is narrower and harder. After you subtract supervision, rework, governance, licensing and training, what’s left? This article uses that net benefit test throughout, with benchmarks you can compare against your own baseline.
Six Benefits of Workflow Automation at a Glance
One result shows why owners get excited, and why they should stay careful. In a 2025 RPA study of 100 requests, manual processing took about 1,000 minutes and automated processing took 135 minutes, a 7.5-fold cut in cycle time. That’s a real benchmark for stable, rule-based work. It isn’t a forecast for every workflow.
Workflow Automation Benefits With Evidence Benchmarks
| Benefit | What Changes in the Workflow | Benchmark From Research | Metric to Track |
|---|---|---|---|
| Productivity | Software steps run without queues between handoffs | 7.5-fold cycle-time cut, 1,000 to 135 minutes per 100 requests | Cycle time per transaction |
| Accuracy | The same validation rules apply to every record | No benchmark provided in the research cited here | First-pass accuracy and rework rate |
| Cost savings | Less manual handling and fewer errors to correct | Leaders 22% vs laggards 8% process-cost savings in 2023 | Cost per transaction |
| Compliance | Approval steps are enforced and every action is logged | No benchmark provided in the research cited here | Share of cases with a complete audit trail |
| Scalability | Volume rises without matching headcount | 21% more cases in a one-week customer-service test, detailed later | Cases completed per labor hour |
| Employee experience | Staff spend time on exceptions and judgement | No benchmark provided in the research cited here | Hours on repetitive work and staff survey score |
Read the cost row with the sample in mind. The 2024 Bain Automation Scorecard survey of 893 automation executives reported leaders averaging 22% process-cost savings in 2023, compared with 8% for lagging companies. The gap matters more than either number alone. It suggests process design and execution discipline separate strong returns from weak ones.
A faster step doesn’t prove a faster process. Track the end-to-end result, from trigger to completed outcome.
Each benefit needs its own metric because gains don’t move together automatically. Cycle time can fall while rework rises. Cost per transaction can fall while audit gaps grow. If you’re building the business case, it helps to measure ROI from business automation benefit by benefit, instead of rolling everything into one vague efficiency claim.
What Workflow Automation Is and Why It Matters
Think of a restaurant ticket printer. When a server enters an order, the printer routes each item to the right kitchen station right away. Nobody carries paper slips across the room or decides where each one goes. Workflow automation does the same routing work for office processes.
The diagram below maps that idea into parts you can inspect before you buy or build anything.
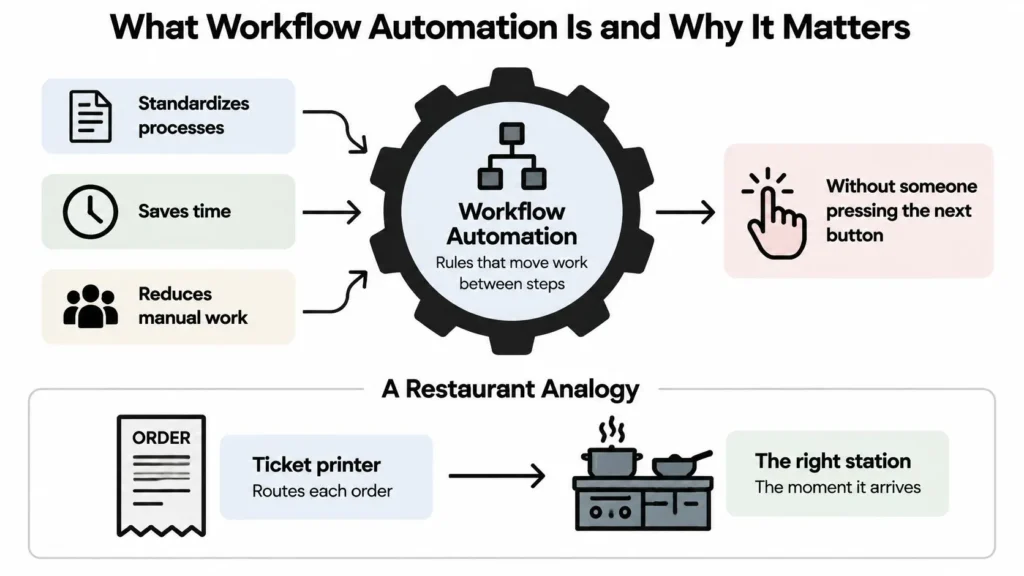
The Three Parts in Every Workflow
- Trigger: Something starts the work, such as a supplier invoice arriving by email.
- Rules: The system checks conditions, such as the amount, supplier name and purchase order number.
- Actions: The system routes the invoice to an approver, then posts approved data to the accounting system.
People don’t disappear from that picture. They handle exceptions, unclear documents and decisions the rules can’t settle. A good design makes that human work visible instead of pretending it won’t happen. For a broader plain-language primer, see the workflow automation insights from Magnitude Marketing.
The scale of the opportunity is large, but it’s activity-level, not job-level. The McKinsey Global Institute 2017 analysis of automation potential estimated that 49% of activities people were paid to perform globally had technical potential to be automated with technologies already demonstrated at the time. McKinsey also modeled automation raising global productivity growth by about 0.8 to 1.4 percentage points annually, under its stated workforce assumptions, in that same analysis.
That distinction changes how you should plan. Most jobs mix automatable and non-automatable tasks, so the practical win usually comes from redesigning a workflow, not removing a whole role. A reusable definition is this. Automation moves repetitive, rule-based steps to software and frees people for judgement.
Measuring ROI and the KPIs That Prove It
A workflow that runs faster does not automatically save money. Measure what it costs to supervise, correct, maintain and train people to use, then compare those costs with the value of time saved. A reliable calculation starts with a baseline recorded over several weeks, before automation changes the work.
Start With a Baseline You Can Defend
Choose a normal operating period, not an unusually quiet week. Count completed cases, and record cycle time, labor hours, throughput, rework, first-pass accuracy and exception rate. Define each measure in advance so the team applies it consistently.
For each case, note who handles it, where it waits and why it returns for correction. If you compare teams, align definitions using performance indicator benchmarking methods. Otherwise, a “completed case” may mean different things in different teams.
Process mapping can expose steps that staff overlook when estimating the current workload. In a 2024 BearingPoint and BPM&O survey of 676 process-management experts, process-mining use was associated with 33% cost savings. Treat that result as a reason to examine the actual process, not as a forecast for mapping or automation alone.
KPIs and ROI Formulas for a Workflow Automation
| KPI | Formula | Worked Example |
|---|---|---|
| Cycle time reduction | Manual minutes minus automated minutes, divided by manual minutes | 1,000 minus 135, divided by 1,000, equals about 86% less time in the 2025 study noted earlier |
| Cost per transaction | Total monthly process cost divided by transactions completed | Use your own baseline cost and completed volume |
| Net automation benefit | Value of time saved minus build, license, supervision, rework and training costs | Positive only when total costs stay below the value of time saved |
| Payback period | Upfront cost divided by monthly net benefit | Use your own upfront cost and monthly net benefit |
| First-pass accuracy | Cases correct on first attempt divided by cases completed | Set the starting value from your own baseline |
| Exception rate | Cases needing manual handling divided by total cases | Set the starting value from your own baseline |
The 2025 study’s 86% cycle-time reduction shows the time difference between its manual and automated process. It does not establish a net benefit or a five-year total-cost result. A shorter cycle matters financially only if the value of released labor and added capacity exceeds implementation, supervision, rework, governance and training costs.
Calculate that net figure over the same period for both options. Estimate the time saved per case, multiply by the number of cases completed, then value the saved labor at your actual cost. Subtract build and licensing costs, staff time spent reviewing exceptions and maintaining rules, rework, governance, and training. Include only capacity you can use or labor cost you can reduce. If exception rates rise, supervision and correction costs can erase the apparent gain.
Licensing can be easy to miss because tiers, automation add-ons and support levels affect the monthly total. Check current Freshservice licensing costs before calculating payback, then include internal maintenance and supervision even when they do not appear on an invoice.
Practical rule: Compare manual and automated performance on the same transaction mix, or don’t compare them at all.
A pilot that handles only clean cases cannot be fairly compared with a baseline containing difficult ones. Keep case types, volumes and quality checks consistent. Track exceptions and rework alongside cycle time, so a faster process counts as a gain only when its full operating costs support that conclusion.
Productivity, Accuracy and Scale in Real Operations
Automation can raise output while leaving completed work unchanged if it speeds up only one step. Consider an illustrative intake-team scenario: staff enter details from forms, check required fields, follow up on missing information and send complete cases to specialists. Automating entry and validation can reduce the time cases spend at intake, but it may also send cases to a review queue faster than specialists can process them.
The queue then becomes the constraint. Customers see little benefit if case completions remain flat, even when the front-end dashboard improves. In this scenario, the team changes review rules so low-risk cases with complete data receive a lighter check, while specialists focus on conflicting records, unusual values and cases with legal or financial consequences. Throughput improves only when the redesigned steps work together.

Why the Gain Is Not Just Faster Typing
A controlled customer-service comparison offers a benchmark for how automation can affect output. In a controlled customer-service BPO comparison, an RPA-enabled group handled 21% more cases than a human-only control group during a one-week evaluation. The described mechanism included standardized data retrieval, consistent validation and removal of low-value administrative steps. Staff could then spend more time on exceptions and customer-facing judgement.
Consistent rules can reduce variation between staff members and shifts. A record that fails a required check is flagged each time. Yet an incorrect rule also repeats reliably. If validation rejects a valid format or accepts an invalid one, the error can spread across records until the rule is reviewed.
Separate two accuracy questions: does the system apply a rule consistently, and is that rule correct for real cases, including edge cases that experienced staff handle through judgement? Automation can address the first. Your team remains responsible for the second, including testing and correcting rules.
Track Capacity at the Process Level
Robot runtime alone says little about whether customers receive completed work sooner. A step may run in seconds while its case waits days for approval. Track cases completed per labor hour, first-pass accuracy, exception rate, average queue age and the share escalated to specialists. These measures reveal whether capacity has increased or work has accumulated elsewhere. They also support efforts to improve operational efficiency across end-to-end processes.
Long-run evidence points to gains at a broader level. Research by Georg Graetz and Guy Michaels, cited in a 2017 submission to the UK Parliament, examined robot density in 17 countries from 1993 to 2007. The authors reported annual labor-productivity growth of 0.36 percentage points and annual GDP growth of 0.37 percentage points associated with higher robot density. Those figures describe an economy-wide historical result, not a forecast for an individual office workflow.
Industrial robots and office automation operate in different settings, so the macro figures cannot be applied directly to a local business case. Their practical lesson is that sustained gains depend on both repeatable tasks and the redesign of surrounding work. Speeding up one isolated step may only move the delay.
If downstream approvals, investigations or exception queues stay fixed, a faster front-end step mainly creates a longer line.
Judge the 21% result as a short-evaluation benchmark, not a promised long-term gain. For your own workflow, compare time saved with the added time spent on supervision, rework, governance and training. Subtract those costs from the labor time automation releases, then check whether completed cases rise without worsening accuracy or queue age. The net figure, shaped by process design and exception rates, is more useful than headline speed.
Cost, Compliance and Staff Gains by Sector
A 2024 Forrester Consulting study commissioned by Microsoft found that employees handling high-volume, repetitive tasks saved 200 hours per year through robotic process automation. Microsoft commissioned the study, so verify the figure against your own workflow before using it in a forecast. It is a reference point, not a sector-wide result.
Workflow Automation Gains and Watch-Outs by Sector
| Sector | Typical Workflow | Staff and Cost Gain | Compliance Watch-Out |
|---|---|---|---|
| Banking | Loan document checks and payment alerts | Hypothesis to test: fewer review hours per completed case. Include time spent on exceptions and audit preparation in the net calculation. | Audit trails and access controls for customer data |
| Healthcare | Patient intake and insurance claims | Hypothesis to test: fewer hours correcting missing or mismatched fields, after counting staff review of exceptions. | Patient privacy rules and logged access |
| Retail and e-commerce | Order-to-ship and returns processing | Hypothesis to test: fewer manual touches and less rework per order, weighed against exception handling and refund review. | Consumer data handling and refund approval limits |
| Media and publishing | Content approvals and rights clearance | Hypothesis to test: fewer staff hours spent on approval handoffs, provided rights checks remain accurate. | License terms and accurate rights records |
| Education | Admissions and enrolment checks | Hypothesis to test: less processing and re-keying time per application, after review of incomplete records. | Student record privacy |
| Hospitality and travel | Booking changes and supplier invoices | Hypothesis to test: fewer hours reconciling unmatched items, less the time needed for staff review. | Payment data security |
| Logistics | Shipment documents and customs forms | Hypothesis to test: fewer corrected documents per shipment and less rework, with customs checks retained. | Customs filing accuracy and records retention |
These are workflow hypotheses, not documented sector benchmarks. To test one, record current staff hours per completed case, rework, exception volume, and compliance checks. Then measure the same items after automation. Subtract supervision, training, governance, and correction time from the hours saved. Convert the remaining staff time into a cost estimate using your own labor costs. If the net figure is small or negative, faster processing alone has not delivered a gain.
Banking and healthcare need particular care because their workflows handle sensitive customer or patient data. Measure any time saving alongside the work needed to preserve audit trails, logged access, and permissions. If automation weakens evidence of who approved a decision and when, the resulting risk can outweigh the labor saved.
Retail, hospitality, and education offer a testable starting point where staff repeatedly re-key details, chase email approvals, or reconcile mismatched records. Compare manual handling and exception hours before and after, then check whether released time supports service, student support, or case resolution. For a measurement approach focused on improving employee productivity without just adding monitoring, track completed work and its quality, not activity alone.
In media and logistics, speed depends on reliable records. Faster content approval does not help if rights data is wrong, and faster shipment paperwork does not help if customs filings contain errors. Keep human review where mistakes carry legal, financial, or delivery consequences, and count that review in the net-benefit calculation.
Common Pitfalls and Who Carries the Risk
Net benefit depends on what automation saves after supervision, rework, governance and training costs are counted. PwC’s 2025 Global AI Jobs Barometer found that productivity growth in industries more exposed to generative AI rose from 7% in 2018 to 2022 to 27% in 2018 to 2024. This is a macro trend tied to generative AI exposure, not evidence that a specific rule-based workflow will produce a net gain. It makes the distinction clear: broad productivity growth can coexist with costs and risks inside individual processes.
To calculate a workflow’s net benefit, compare labor time saved with the time spent checking outputs, correcting errors, handling exceptions, maintaining rules and training staff. If exceptions are frequent or decisions need close review, those costs can consume the time saved. Measure both sides before treating faster processing as a return.
Where Gains Quietly Disappear
- Automating a broken process: Software repeats unclear steps faster, while making the underlying confusion harder to spot.
- Leaving exception queues unowned: Cases accumulate when nobody is responsible for resolving them or adjusting the process.
- Skipping the baseline: Without before-and-after measures, leaders cannot tell whether cost, cycle time or quality improved.
- Having no owner for rule changes: Policies, forms and systems change. Rules that do not keep pace can create errors and rework.
- Leaving access rights unreviewed: Automated accounts may retain more system access than their tasks require, increasing the consequences of a security failure.
The people affected carry different parts of the risk. A 2025 study on robotic process automation obstacles and workforce views reported that 68% of employees viewed RPA as a way to reduce repetitive work and enable more strategic or creative activity, while 32% worried about job displacement. The same study reported data-security threats at 45% of businesses. That figure signals a governance concern for automation projects: systems need appropriate permissions, monitoring and accountable owners, especially when workflows handle sensitive information.
Executives may focus on operating cost. Workers may spend less time on repetitive tasks but face closer monitoring or lose skills if their work is reduced to exceptions. Customers may receive faster service yet have less recourse when an automated decision is wrong. Set out who reviews failures, corrects records and answers complaints before launch.
Some workflows should remain human-led. Appeals, complex complaints and decisions with legal effect require accountable judgement and a clear way to challenge an outcome. Automation can prepare information for review, while a person remains responsible for the decision.
Pick Your First Workflow and Set a Baseline
Choose a workflow whose results can be measured and whose inputs are dependable. Before starting, check source data quality and who can access each system the process touches. Treat vendor-sponsored benchmarks as upper-end references, not as a forecast for your operation.
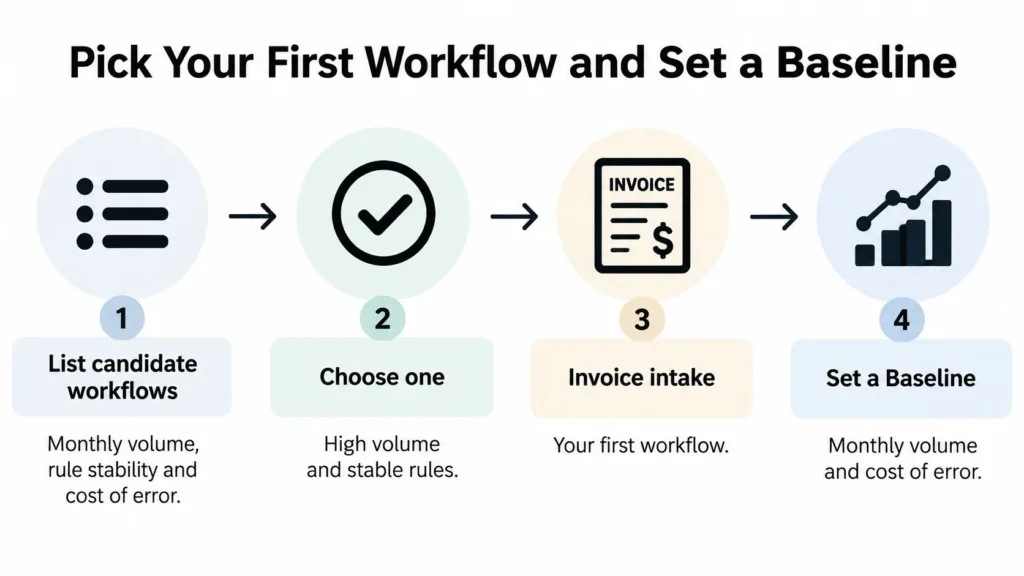
Five Steps Before You Scale
- Rank candidates by volume, rule stability and error cost. Invoice intake or request routing may suit a pilot when inputs are repeatable and errors have a clear cost.
- Record a four-week baseline. Measure cycle time, labor hours, rework, first-pass accuracy and exception rate. These figures give you a comparison point.
- Map exceptions and assign a rule owner. Unowned exceptions can absorb time savings without appearing in headline speed figures.
- Pilot with the same transaction mix. Track exception rates weekly, log rule changes and review failures with the staff who handle them.
- Make a decision at 90 days. Compare the net benefit with the baseline. Scale, redesign the human steps or stop.
The video below offers a visual walkthrough for mapping a candidate workflow and its baseline fields.
A successful pilot still needs a clear verdict. Continue automation only if time saved exceeds the costs of supervision, rework and training. Include governance costs in that calculation, too. If the net benefit is not positive, redesign the process or stop; the test has done its job.
If you’re weighing which process to automate first, maxijournal.com publishes practical business and technology guides on productivity, operations and workplace technology. Visit the site to explore them, then calculate the net benefit for your own shortlist before committing budget.
Discover more from Maxi Journal
Subscribe to get the latest posts sent to your email.