A data center can improve its Power Usage Effectiveness, or PUE, from 2.5 to 1.59, a long-term shift that means considerably less electricity is spent on cooling, power distribution, lighting, and other overhead for each unit of IT work delivered, according to the International Energy Agency’s review of data center efficiency. That improvement matters because the sector consumed an estimated 240 to 340 TWh of electricity in 2022, roughly 1 to 1.3% of global final electricity demand, as reported by the IEA’s data center analysis.
Energy efficiency in data centers isn’t just a sustainability badge or a technical score. It affects operating costs, available power capacity, cooling resilience, hardware utilization, water decisions, and the financial case for new infrastructure. The best approach treats the facility as one connected system, then measures whether each investment delivers useful computing with fewer total resources.
Why Energy Efficiency Defines Modern Data Centers
A server rack rarely looks wasteful from the outside. It processes applications, stores records, responds to customers, and supports business operations. Yet every unit of computing also creates heat, draws power through electrical equipment, and may require cooling infrastructure that runs even when workloads fluctuate.
Multiply that hidden overhead across a large facility and the business problem becomes clear. The IEA estimates that data centers used 240 to 340 TWh of electricity in 2022, equivalent to about 1 to 1.3% of global final electricity demand. Since 2010, data center energy use has grown only moderately despite rapid digital expansion, largely because operators have adopted more efficient hardware and cooling and moved workloads from smaller enterprise rooms into larger cloud and hyperscale facilities. These gains show what good engineering can accomplish, but they don’t eliminate the need for further action.
A useful way to understand the issue is to follow one workload. An application request reaches a server, the server converts electricity into computation, and the resulting heat travels into the cooling system. Power supplies, batteries, chillers, fans, pumps, lighting, and distribution equipment all consume energy along the way. If the workload runs on an underused server or in a poorly contained room, the facility spends more to deliver the same result.
Efficiency has three business tests
A project deserves attention when it improves more than a dashboard number.
- Cost: Does it reduce electricity use, avoid new capacity, or lower peak demand?
- Performance: Can the facility deliver the required computing service without compromising availability?
- Sustainability: Does it reduce energy, carbon intensity, water use, or dependence on scarce resources?
Renewable electricity can reduce the environmental impact of a facility, but it doesn’t automatically fix inefficient cooling or underused servers. Readers who want a broader foundation can review this explanation of what renewable energy means, then return to the facility question: how much electricity does the data center need in the first place?
Practical rule: Treat every watt as part of a chain. The useful question isn’t only how clean the electricity is, but how much computing that electricity produces.
The rest of the engineering decision follows from that principle. Measure the facility, locate avoidable overhead, improve airflow and power delivery, optimize workloads, then test whether the changes remain effective as demand grows. Efficiency isn’t a one-time purchase. It’s an operating discipline.
What Energy Efficiency Really Means Inside a Data Center
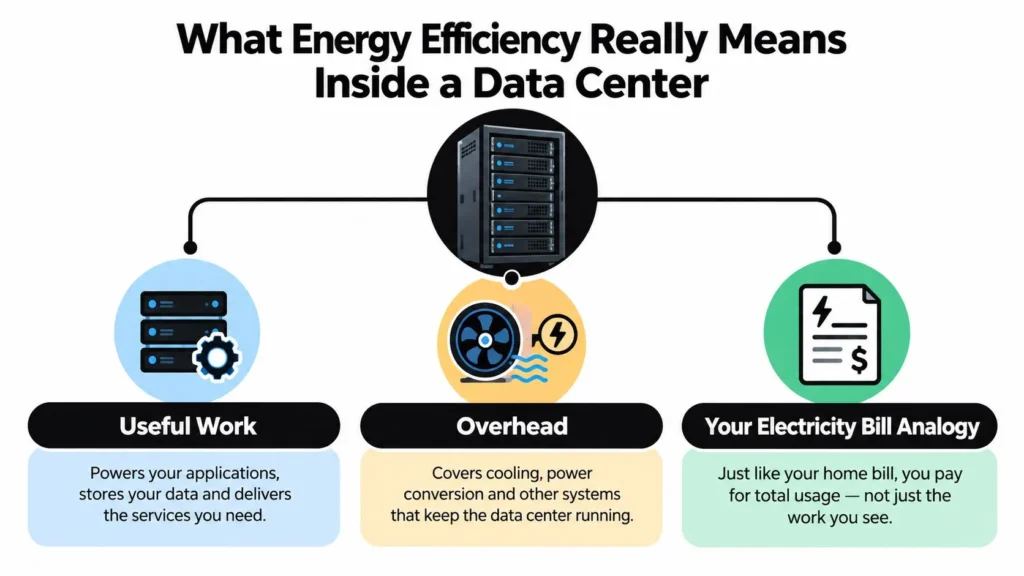
Start with a household electricity bill. Some electricity powers activities you want, such as refrigeration, lighting, or charging a device. Other consumption supports the delivery of that service, such as heat lost in an appliance or energy used by equipment that keeps the home comfortable. A data center has the same basic split, only with much larger and more tightly controlled systems.
IT energy powers servers, storage, and networking equipment. This is the useful load because it performs the computing work. Facility overhead supports that load through cooling, pumps, fans, chillers, power distribution, lighting, monitoring, and backup systems. An efficient facility reduces unnecessary overhead while preserving the performance and resilience that the IT equipment requires.
Follow the energy path
Think of efficiency as a sequence rather than a single device rating.
- Electricity enters the facility. Transformers, switchgear, UPS systems, and distribution equipment prepare it for use.
- IT equipment performs work. Processors, memory, drives, and network components consume power according to workload and operating conditions.
- Heat leaves the rack. Fans, air handlers, pumps, heat exchangers, chillers, or liquid loops carry heat away.
- The facility maintains conditions. Controls keep temperature, humidity, pressure, and redundancy within safe operating limits.
Losses can occur at every stage. A lightly loaded server may consume substantial power without producing much useful work. Poorly arranged racks can mix hot exhaust air with cooled supply air, forcing fans and chillers to work harder. An oversized UPS or cooling plant may operate inefficiently because it serves capacity that isn’t currently needed.
More compute per watt is the real objective
The phrase energy efficiency in data centers can sound as if it refers only to facility machinery. In practice, it includes the relationship between energy and useful output. A newer server may consume less power for a given task, but the result also depends on software configuration, workload placement, processor utilization, storage design, and network traffic.
This is why a single upgrade rarely solves the whole problem. A cooling retrofit can reduce overhead while an application team continues running unnecessary instances. Conversely, server consolidation can reduce IT demand while an uncontrolled airflow pattern forces the cooling system to compensate.
Efficiency improves when the facility delivers the same service with less total energy, not merely when one component looks better in isolation.
Operators should therefore collect both energy and operational context. Record facility power, IT power, temperatures, airflow conditions, utilization, and workload demand. The aim isn’t to punish a team for using electricity. It’s to distinguish necessary consumption from energy that produces little or no useful computing.
How to Measure Efficiency with PUE and DCiE
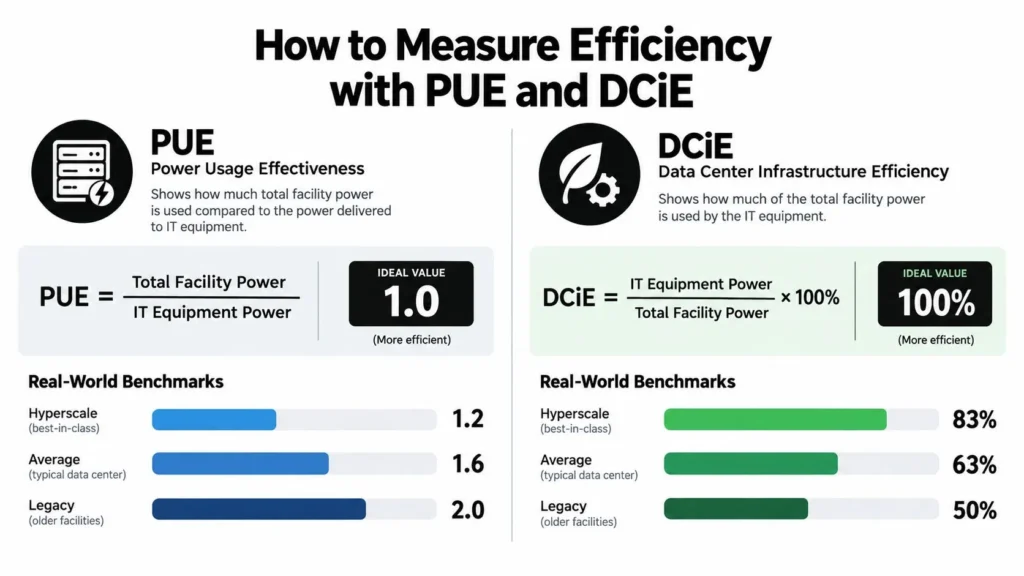
Power Usage Effectiveness, or PUE, gives operators a simple facility-level ratio:
PUE = total facility energy ÷ IT equipment energy
An ideal PUE is 1.0, because every unit of facility energy would reach IT equipment and none would be spent on overhead. Real facilities need cooling, power conversion, lighting, controls, and other support systems, so the number is higher. Lower is generally better, provided the measurement boundary and operating conditions are comparable.
The inverse metric is Data Center Infrastructure Efficiency, or DCiE:
DCiE = IT equipment energy ÷ total facility energy
DCiE expresses the IT share as a percentage or decimal. If a facility has a PUE of 1.5, its DCiE is approximately 66.7%, calculated by taking the inverse of the PUE. That result means roughly two-thirds of measured facility energy reaches IT equipment, while the remainder supports the surrounding infrastructure.
Read the benchmark in context
The IEA review reports that the global average PUE fell from 2.5 in 2007 to 1.59 in later industry reporting, reflecting long-term improvements in cooling, server efficiency, and facility scale. Stanford’s review reports that state-of-the-art facilities can reach a PUE of about 1.06, while conventional air-cooled sites commonly operate around 1.3 to 1.5, as described in its data center efficiency analysis.
The difference is easier to understand as overhead:
| PUE | Approximate overhead above IT load | Interpretation |
|---|---|---|
| 1.06 | About 6% | State-of-the-art facility benchmark |
| 1.30 | About 30% | Efficient conventional operation |
| 1.50 | About 50% | Common air-cooled range |
| 1.59 | About 59% | Later global average reported by the IEA |
The table isn’t a universal grading scale. Climate, redundancy, maintenance mode, utilization, and measurement boundaries can all affect the result. A facility should compare itself with similar facilities and track its own trend rather than chase a single attractive figure.
For readers who want a deeper explanation of measurement choices and cooling relationships, these insights on data center energy metrics provide useful additional context. PUE is valuable, but it doesn’t tell you whether the IT load is productive, whether the electricity is clean, or whether the cooling approach consumes scarce water.
Cooling Airflow and Rack Design That Cut Waste
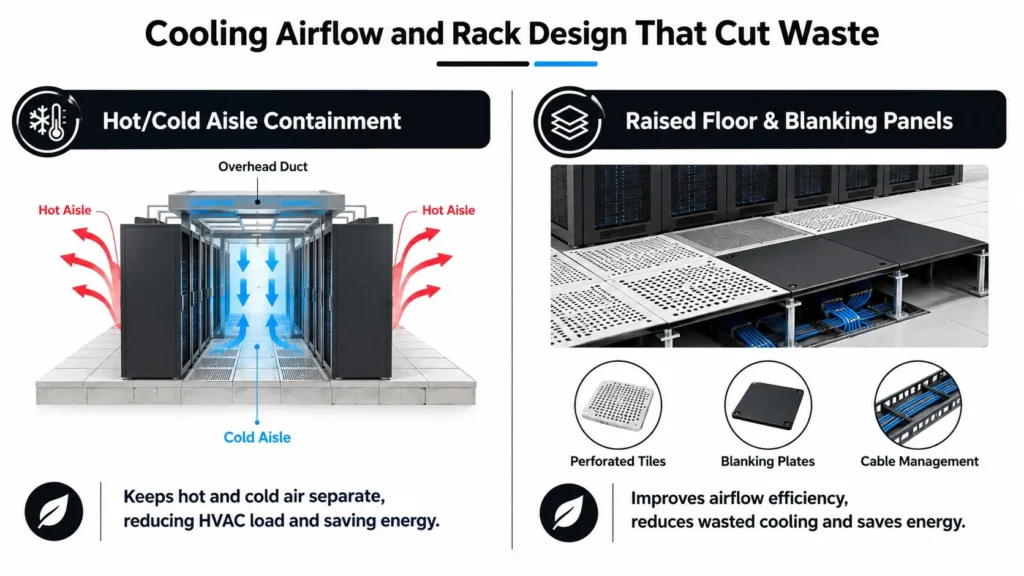
Cooling waste often begins with air moving in the wrong direction. A cold aisle should deliver cool supply air to server intakes, while a hot aisle should receive the exhaust. When those streams mix, the cooling system may lower supply temperatures or increase fan speed to compensate, even though the underlying problem is layout.
Hot and cold aisle containment makes the airflow path more deliberate. Containment barriers, overhead ducts, floor tiles, blanking panels, and careful cable management prevent cooled air from bypassing equipment or hot exhaust from recirculating. Raised-floor systems can distribute supply air effectively when the plenum, perforated tiles, rack placement, and pressure controls work together.
Air cooling still has a role
Air cooling remains practical for moderate rack densities, existing facilities, and environments where operators value familiar maintenance procedures. Its performance improves when teams seal gaps, install blanking panels, remove obstructions, balance supply air, and use control systems that respond to actual thermal conditions rather than running every unit at maximum output.
Liquid cooling becomes more compelling as rack density rises. Liquid carries heat more effectively than air, allowing direct-to-chip systems or immersion designs to reduce the fan and air-handling work associated with high-density computing. Vertiv’s fully implemented liquid-cooling study found facility power fell by 18.1% and total data center power fell by 10.2% compared with 100% air cooling, with more than a 15% improvement in Total Usage Effectiveness. Those figures come from the Vertiv liquid-cooling analysis, so operators should treat them as study-specific evidence rather than a guaranteed result for every retrofit.
A facility should choose cooling by density, climate, water availability, maintenance capability, and expansion plans.
| Cooling Method | Energy Impact | Best For |
|---|---|---|
| Contained air cooling | Reduces mixing, fan demand, and unnecessary chiller work | Moderate-density racks and many retrofit projects |
| Direct-to-chip liquid cooling | Removes heat near the processor and reduces air movement | High-density CPU and GPU deployments |
| Immersion cooling | Transfers heat through a conductive liquid surrounding equipment | Specialized high-performance computing environments |
| Free cooling | Uses favorable outdoor conditions to reduce mechanical cooling | Facilities with suitable climate and control design |
Airflow changes usually offer a lower-disruption starting point. Liquid cooling can deliver larger benefits for concentrated high-density loads, but it introduces new distribution, maintenance, leak-management, and equipment-compatibility requirements.
The video below provides a visual introduction to airflow behavior and containment decisions.
Smarter Power and IT Strategies From Virtualization to Renewables
Cooling improvements address facility overhead, but the IT load itself sets the floor below which total consumption can’t fall. The strongest programs improve both sides. They consolidate useful work, eliminate idle capacity, reduce electrical losses, and match computing resources to actual demand.
Start with workload discipline
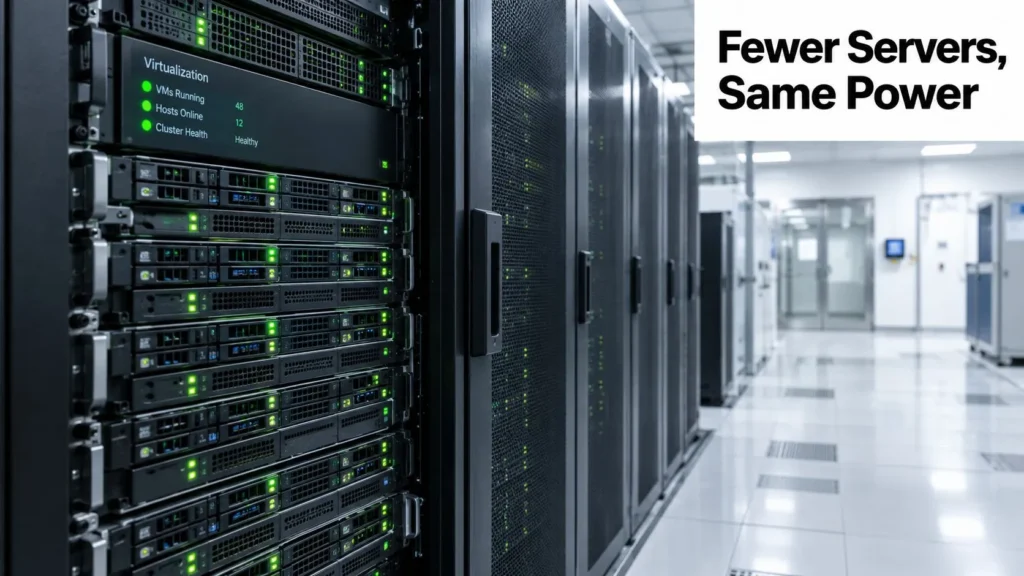
Virtualization allows multiple workloads to share physical servers, which can raise utilization and reduce the number of machines that need to run continuously. Container platforms can provide a similar consolidation path for suitable applications. The engineering caution is simple: consolidation should preserve performance, security, resilience, and operational separation.
Teams can also schedule flexible workloads for periods or locations where electricity and cooling conditions are more favorable. Batch analytics, backups, software testing, and model preparation may offer more placement flexibility than latency-sensitive services. Workload shifting doesn’t remove the energy requirement, but it can reduce local peaks and improve the use of available infrastructure.
Reduce losses in the power chain
UPS systems, transformers, switchgear, and power distribution units all introduce conversion and standby losses. Operators should measure them at meaningful load levels, check whether redundancy arrangements leave equipment lightly loaded, and select efficient operating modes without weakening uptime protection.
Battery technology also affects resilience planning. A clear explanation of how lithium batteries work can help non-specialists understand why storage chemistry, charging, thermal management, and safety controls matter. The right battery system isn’t automatically the most energy-efficient choice, because lifecycle performance depends on operating conditions and maintenance.
Add cleaner electricity after reducing waste
Renewable procurement can lower the carbon impact of the electricity that remains. On-site solar, contracted renewable supply, and other purchasing arrangements each involve different site, grid, and accounting considerations. Renewable power shouldn’t become a reason to tolerate inefficient hardware or cooling. Lower demand improves the economics and makes clean supply easier to integrate.
Waste heat can also become a useful local resource when a suitable building, greenhouse, or district heating connection exists. The opportunity depends on temperature, distance, demand timing, and infrastructure. For a real facility reference that combines computing infrastructure with sustainability considerations, readers can explore the MGHPCC facility.
A practical order is to remove idle capacity, consolidate workloads, improve power delivery, then evaluate renewable electricity and heat reuse. That sequence protects capital because it reduces the size of later infrastructure requirements.
Monitoring Measurement and Standards That Keep You Honest
An efficiency project can look successful during commissioning and lose its gains later. Filters clog, rack layouts change, workloads move, control settings drift, and new equipment gets installed without updating the cooling model. Continuous measurement turns efficiency from a launch event into an operating habit.
A useful monitoring hierarchy has three layers:
- Facility layer: Meter incoming utility energy and major mechanical systems, including chillers, pumps, cooling towers, air handlers, and lighting.
- IT layer: Measure server, storage, and networking energy, ideally with enough detail to connect power to workload and utilization.
- Resource layer: Track water consumption, temperatures, humidity, airflow, renewable electricity, and waste heat where those factors affect the operating decision.
PUE remains the central facility metric, but the number is only useful when teams define consistent boundaries and sampling periods. Compare similar operating states, document maintenance conditions, and investigate sudden changes instead of celebrating a favorable monthly average.
Water changes the decision
The Uptime Institute’s 2025 survey found an industry-average PUE of 1.54, flat for six straight years, while water usage was the only metric in its reporting that showed a measurable increase. These findings appear in the Uptime Institute 2025 annual survey.
That creates a direct engineering trade-off. A cooling design may reduce electricity use while increasing water demand, especially under dense AI workloads. Operators should therefore review PUE alongside water usage, energy source, carbon impact, IT utilization, and service performance.
European reporting is moving in this direction. EU rules explicitly track energy performance and water usage, and the European Commission is working toward a common EU-wide data center rating scheme, according to the Uptime Institute survey. A scorecard that reports only PUE can hide important resource costs.
A lower PUE is useful evidence, not a complete sustainability verdict.
Governance closes the loop. Assign owners to each metric, set alert thresholds, review exceptions, and require efficiency data in capacity and procurement decisions. Measurement should influence behavior before waste becomes a budget surprise.
Your Roadmap to Efficient Cost Effective Implementation
The best roadmap starts with evidence, not a shopping list. First establish a baseline for facility energy, IT energy, cooling behavior, utilization, water, and workload demand. Then identify the changes that reduce waste without putting availability at risk.
Phase one targets reversible waste
Begin with airflow inspection, blanking panels, containment repairs, temperature and pressure controls, server power settings, virtualization, and removal of unused equipment. These measures often require coordination more than construction. They also reveal whether the facility’s problem is poor design, poor operation, or unnecessary IT demand.
The business case should record the baseline, expected energy reduction, implementation cost, maintenance impact, and effect on available capacity. Guidance on electricity reduction for property managers can help teams frame facility savings in operational terms rather than treating them as an isolated engineering project.
Phase two improves the system
Next, examine UPS loading, power distribution, chiller controls, pumps, fans, heat exchangers, and monitoring coverage. Compare air and liquid cooling against the actual density profile, not a projected marketing scenario. A liquid system may be financially sensible for a concentrated AI cluster while remaining unnecessary for conventional racks.
Renewable electricity belongs in the same investment discussion, but demand reduction should come first. Readers evaluating options can also review the latest technology in solar panels as part of a broader clean-power assessment. The right choice depends on grid conditions, site constraints, operating profile, and contractual structure.
Phase three plans for growth
The IEA says data center electricity use is rising about 15% per year from 2024 to 2030, and its stronger-efficiency scenario still leaves demand near 700 TWh in 2035, with data centers under 2% of global electricity demand, as described in its Energy and AI outlook. In the United States, the EIA estimates that server electricity use represented 7% of commercial-sector electricity consumption in 2025. Efficiency can slow demand growth, but it won’t flatten AI-related load on its own.
That makes software and workload strategy part of the capital plan. Define success through lower energy per unit of useful work, stable or improving service performance, controlled water use, and a credible total-cost calculation. Revisit those measures whenever the workload mix changes.
Maxijournal.com offers approachable writing on science, technology, business, and practical engineering topics, helping readers turn complex ideas into useful decisions. Visit maxijournal.com for more clear guides that connect emerging technology with everyday understanding.
Discover more from Maxi Journal
Subscribe to get the latest posts sent to your email.