You’ve got a science fair deadline on the calendar, a student looking for an idea, and a long list of projects that sound exciting until you ask how to measure them. A strong science fair topic isn’t the most complicated experiment. It’s a focused question with a variable the student can control and results they can record clearly.
The ideas below range from low-cost builds to projects that need careful supervision, specialized equipment, or more time. Each one offers a practical question to investigate, a manageable way to collect evidence, and guidance on difficulty, duration, and grade fit. Students can adapt many of them by using household materials, school equipment, or public data, then make the project more challenging by adding controls or repeating trials. For extra inspiration, browse engaging STEM kits for kids.
A good display doesn’t need to claim a discovery that changes the world. It should help a visitor understand what the student tested, what the results show, and what could be improved next.
1. Plant Growth Under Different Colored LED Lights
Difficulty: Beginner to intermediate
Duration: Several weeks
Suggested grades: Elementary through high school
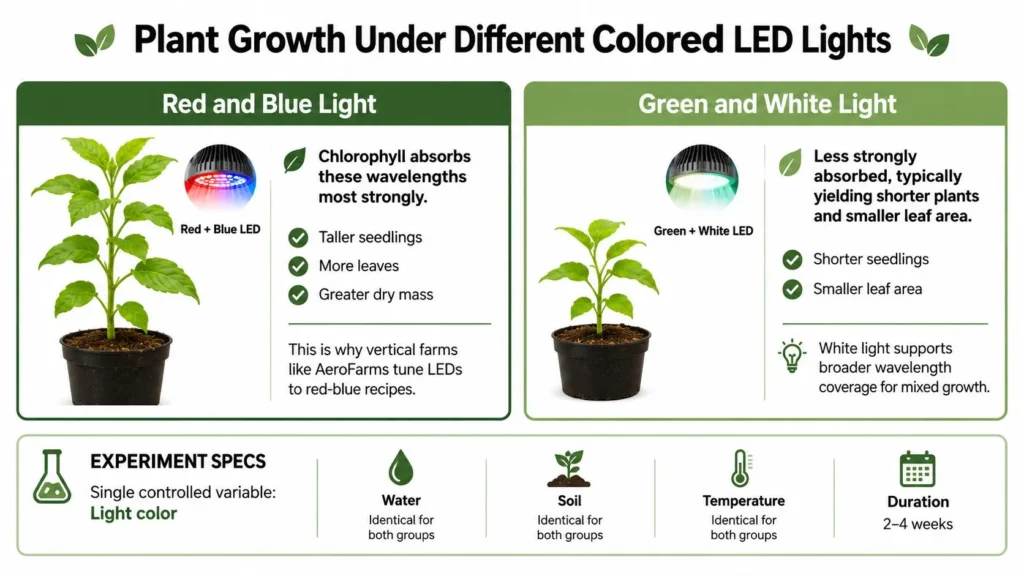
Which light color supports the most plant growth? Grow identical seedlings under red, blue, green, white, and full-spectrum LED lights, while keeping soil, watering, temperature, and daily light exposure consistent. The student changes the light color and measures plant height, leaf count, or another clearly defined outcome.
Fair-test rule: Keep the distance between each plant and its light consistent. If a light meter is available, check that the groups receive comparable light intensity.
Use multiple plants in each group and calculate an average for each color. Measure at the same time each day, record watering, and take photos from the same angle. A graph of height over time can reveal patterns that a final measurement alone might hide.
The project introduces photosynthesis and how light conditions affect plant development. It also connects to indoor farming, where growers use LED lighting to cultivate plants. Students can discuss that application without assuming their small experiment will reproduce commercial results.
For a stronger presentation, include a control group under ordinary white light and explain why it matters. Note any differences in germination, wilting, or leaf color, not just height.
2. Making Biodegradable Plastic from Potato Starch
Difficulty: Beginner to intermediate
Duration: Several days to make, plus an extended observation period
Suggested grades: Middle school through high school
A potato-starch film offers a hands-on introduction to materials science. Mix starch, water, glycerin, and vinegar, then heat the mixture with adult supervision until it thickens. Spread it evenly on a non-stick surface and let it dry into a sheet.
The testable question could be: How does the amount of glycerin affect the flexibility of the dried film? Make batches with different glycerin amounts while keeping the other ingredients and drying conditions the same. Compare flexibility using a consistent method, such as bending each sample around the same object and recording whether it cracks.
Small changes to the recipe can make the film behave differently, so measure ingredients carefully and label every batch.
For an extension, place a sample of the film and a conventional plastic control in separate containers of soil. Observe them over time and document visible changes. This comparison can be informative, but it doesn’t prove a material is environmentally harmless or will break down in every setting.
The project makes a practical link to efforts to reduce plastic waste. Keep the cooking step supervised, avoid tasting any materials, and follow school rules for heating equipment. A clear presentation should show the recipe, conditions, sample labels, and any limitations in the decomposition test.
3. Building and Testing a Solar Oven
Difficulty: Beginner
Duration: One or more sunny days
Suggested grades: Elementary through middle school
A cardboard solar oven turns sunlight into a measurable experiment. Line a box with aluminum foil to reflect light toward its interior, cover an opening with plastic wrap, and place black paper or a dark container inside to absorb heat. Use a thermometer to track the temperature.
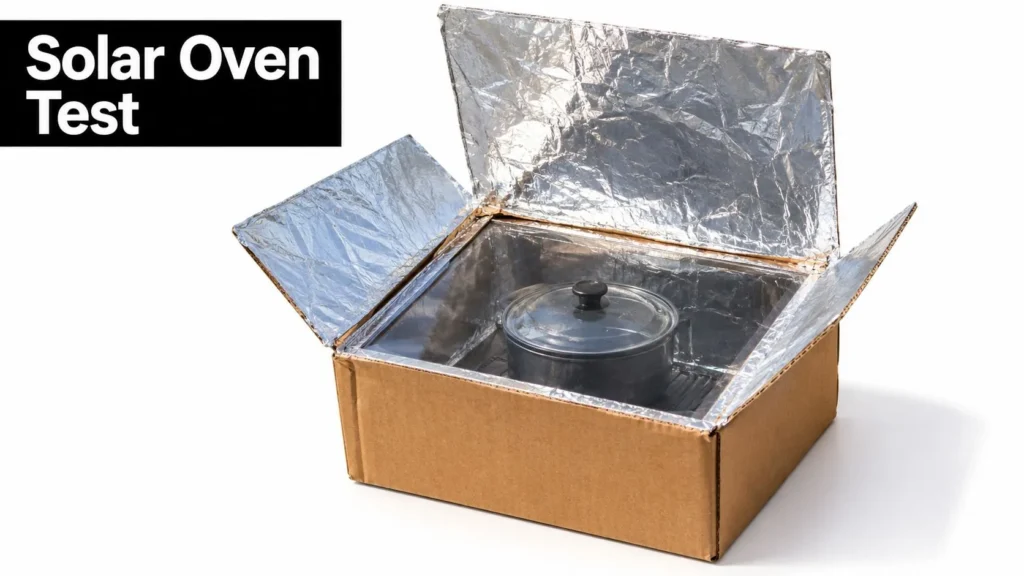
Instead of asking whether the oven “works,” ask how the color of the container affects heating. Compare black and white containers with the same amount of water. Place them in the same oven, start at the same temperature, and record readings at regular intervals. Testing in similar sunlight and keeping the thermometer position consistent will make the comparison more useful.
Students can explain how reflection, absorption, and insulation contribute to warming. A solar cooker also provides a real-world connection to cooking without conventional fuel, but this model’s results won’t show how well a full-size cooker would perform.
Safety note: Don’t eat food prepared in a classroom solar oven. The setup may not heat food evenly or reach a safe temperature.
A temperature-over-time graph gives visitors an easy way to see the outcome. For added context, students can explore how solar panels use current technology, then explain how a solar oven differs from a device that converts sunlight into electricity.
A short build demonstration can help younger students explain the design:
4. Microbial Fuel Cell Using Soil Bacteria
Difficulty: Advanced
Duration: Several days to multiple weeks
Suggested grades: High school, with teacher supervision
Soil contains microorganisms that break down organic matter. A microbial fuel cell uses that biological activity to produce a small electrical output. Students can place soil or another approved organic substrate in a container with electrodes, connect the circuit to a multimeter, and track voltage over time.
The question should be narrow, such as does the measured voltage differ between soil and vegetable waste under the same setup? Keep the container, electrode spacing, measurement schedule, and environmental conditions consistent. Record temperature and pH if the school has suitable tools, since changes can affect biological activity.
A multimeter makes the project’s main outcome visible, but readings may fluctuate. Keep a dated log and repeat measurements rather than selecting only the highest result. Students can also compare voltage at different times and describe how the system changes as microorganisms interact with the electrodes.
This investigation connects biology, chemistry, and renewable-energy research. It also calls for careful handling: use gloves, don’t open or sniff cultures, and follow the school’s rules for biological materials and disposal. Avoid claiming that a small classroom setup can power a practical device unless the experiment tests that claim.
For a rigorous display, include a labeled circuit diagram, the measurement method, and a note about limitations such as electrode material or inconsistent contact. The project suits students who are comfortable explaining both the living system and the electrical circuit.
5. How String Tension and Length Affect Musical Pitch
Difficulty: Beginner to intermediate
Duration: A few days
Suggested grades: Middle school through high school
A stretched string can show how changing its physical properties changes the sound it produces. Secure a string across a board or box, then adjust its vibrating length or tension. Use a tuner app to record the pitch, checking the app against a known reference tone where possible.
Test one variable at a time. To study length, keep the string and tension as consistent as possible while changing the distance between its supports. To study tension, keep the vibrating length fixed and adjust tension in a controlled way. Students can plot their measurements and look for patterns rather than assuming the results will match a simple prediction exactly.
Pianos and guitars rely on the relationships among string length, tension, and pitch. That real-world connection gives students a clear reason to investigate the physics, while the experiment remains practical with a simple string-and-board setup.
Change one feature at a time. If length and tension both change, the student can’t tell which one affected the pitch.
Older students can improve precision by using measured weights to apply tension consistently and by comparing repeated readings. Avoid excessive tension, which could snap the string or damage the frame. A strong presentation explains how the student adjusted the string, how pitch was recorded, and why measurement uncertainty matters.
6. Comparing Low-Cost Water Filtration Methods
Difficulty: Beginner to intermediate
Duration: A few days
Suggested grades: Elementary through high school
Which filter arrangement makes cloudy water look clearer? Build simple filters from bottles or funnels using layers of cloth, gravel, sand, and activated charcoal. Prepare one batch of test water and divide it equally among the filters so the starting conditions match.
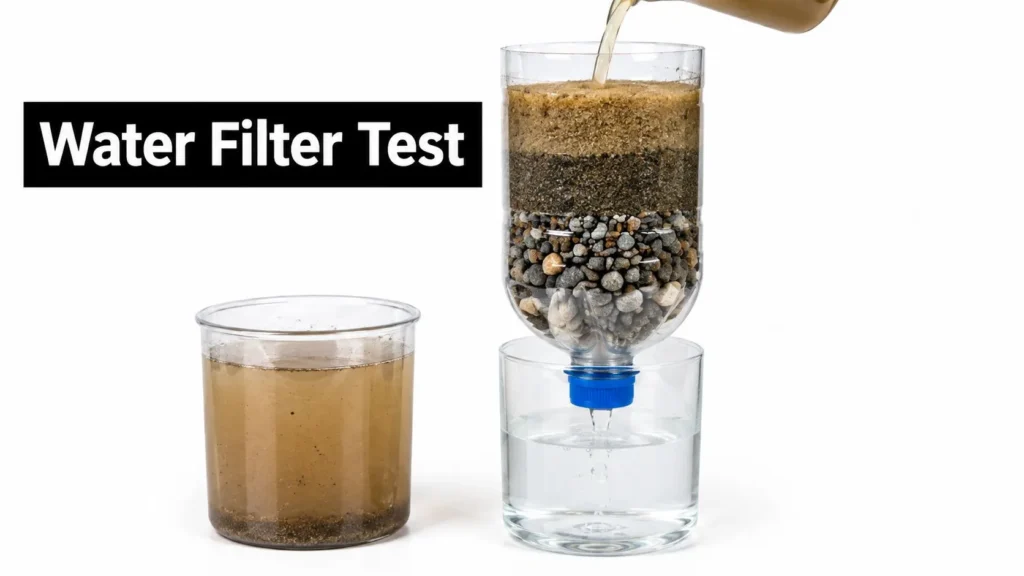
Compare the results by photographing samples against the same background or using a turbidity tool if the school has one. Keep water volume, pouring rate, filter size, and material amounts consistent. Students can test different layer orders, then record color and clarity using the same method for each sample.
A clear-looking sample isn’t necessarily safe to drink. The filter may not remove microorganisms or dissolved chemicals, so label all samples not for drinking and dispose of them as instructed by the teacher.
This experiment can introduce filtration and adsorption while prompting discussion about access to clean water. Students can present their water filtration experiment results as a side-by-side comparison, but should describe only what their own measurements support. Explain which design removed visible particles most effectively and what the test didn’t measure.
7. Testing Household Products for Antibacterial Effectiveness
Difficulty: Advanced, requires approval and appropriate lab facilities
Duration: Several days to multiple weeks
Suggested grades: High school
This microbiology project needs school approval before it begins. If the teacher and fair rules permit it, students can compare approved disinfectants or other products using only school-approved, non-pathogenic organisms. They should never culture unknown bacteria collected from public surfaces or handle plates outside the school’s biosafety procedures.
One possible question is which approved product produces the largest clear zone around a test disk under the same conditions? Students apply each product to prepared plates, follow the approved incubation and disposal process, and measure any clear zones using a consistent method. Use controls recommended by the teacher and repeat the comparison as the approved protocol allows.
A visible zone can make results easy to present, but it doesn’t automatically show that a product is best for everyday use. The outcome can depend on the organism, product concentration, contact time, and lab conditions.
Approval comes first: Don’t buy materials or begin culturing until a teacher confirms that the method and organism meet school and fair rules.
Students who can’t access a suitable lab can choose a safer, non-culture project about hygiene, such as comparing how different washing methods remove a visible marker from hands. That still allows a controlled test while avoiding microbial growth. In either version, the display should distinguish the experiment’s result from broader claims about product safety or effectiveness.
8. Does Video Game Play Improve Reaction Time?
Difficulty: Intermediate
Duration: Several days to a few weeks
Suggested grades: Middle school through high school
To investigate gaming and reaction time, give participants the same simple test before and after a defined gaming session. A ruler-drop test is inexpensive: one person drops the ruler without warning, while another catches it, then records the distance. A computer-based reaction timer is another option, provided everyone uses the same device and procedure.
The question might be does a short session with a fast-paced game change performance on a visual reaction test? Include a comparison group that completes the same schedule without playing the game. Keep testing conditions consistent and record factors such as time of day, rest, and prior gaming experience, without collecting unnecessary personal information.
Human-participant research often has extra school and fair requirements. Ask the teacher before recruiting participants, explain the activity clearly, and follow any consent rules. Don’t pressure classmates to take part or collect identifying details that aren’t needed.
The project connects gaming to cognitive psychology, but a small classroom test can’t establish that video games generally improve reaction time. Students should separate a short-term change from long-term skill and mention possible influences such as practice effects or test familiarity.
Present individual results as well as a group summary when appropriate. Explain how the student kept the test consistent and whether the results varied widely among participants.
9. Building an Image Classifier with Teachable Machine
Difficulty: Intermediate
Duration: Several days
Suggested grades: Middle school through high school
Teachable Machine lets students train a browser-based model to sort images, sounds, or poses into categories. For an image project, a student might train it to distinguish between two kinds of leaves or between objects placed on a plain and patterned background.
Start with a clear question: does background variation affect how reliably the model identifies an object? Collect examples for each category, train the model, and test it on examples it hasn’t seen. Keep a record of correct and incorrect classifications, and describe how the test images differ from the training examples.
A model can appear successful if the training and test images are too similar. Try different lighting, angles, and backgrounds, then discuss whether the model learned the object or relied on an accidental feature. Don’t use classmates’ faces or voices without permission, and avoid uploading sensitive material.
This is a useful way to study machine learning, data quality, and bias without treating AI as a substitute for student reasoning. Students can use a guide to finding credible sources for research to support their background reading, then explain their own training and testing choices.
The presentation should show sample inputs, the classification results, and examples of mistakes. A student should be able to describe what the model learned, what it struggled with, and how they tested its reliability.
10. Paper Airplane Aerodynamics
Difficulty: Beginner
Duration: A few days
Suggested grades: Elementary through high school
A paper airplane project is easy to start, but a fair comparison requires more than throwing different designs and choosing the longest flight. Ask a specific question, such as which wing design travels the farthest when launched from the same position? Fold each design from the same kind of paper and use the same launch height and direction.
A simple launcher can reduce differences in throwing force. If that isn’t available, one student should throw all planes from a marked line using the same technique. Measure flight distance, and consider recording hang time as a separate outcome rather than combining the two.
Run repeated trials for each design and calculate the average and range. Test indoors away from drafts, use the same measurement method, and record failed flights instead of discarding them. Differences in folds or launch angle can affect results, so photograph each design and describe how the student kept it consistent.
Paper airplanes make aerodynamics visible through flight, lift, drag, and gravity. Aerospace engineers study related design questions with more complex tools, but students can make a useful comparison with paper, a measuring tape, and a careful log. The display should show the plane designs, trial results, and the limits of the test.
10 Science Fair Topics Comparison Guide
| Project | Complexity and Duration | Main Resources | Expected Outcome | Ideal Use and Key Advantage |
|---|---|---|---|---|
| Plant Growth Under Different Colored LED Lights | Beginner–intermediate; 2–4 weeks | Seedlings, colored LED lights, pots, measuring tools | Compare plant height, leaf growth, and mass under different light colors | Plant biology and indoor farming; produces clear, graphable data |
| Making Biodegradable Plastic from Potato Starch | Beginner–intermediate; 1–3 weeks, with longer optional tests | Potato starch, water, glycerin, vinegar, heat source | Create films and compare flexibility, water resistance, and breakdown | Materials science and sustainability; inexpensive, visible results |
| Building and Testing a Solar Oven | Beginner; 1–2 weeks | Cardboard, aluminum foil, plastic wrap, thermometer, sunlight | Measure heating rates and compare oven designs | Renewable energy and heat transfer; hands-on and easy to demonstrate |
| Microbial Fuel Cell Using Soil Bacteria | Intermediate; 3–6 weeks | Soil or organic matter, electrodes, containers, wiring, multimeter | Track small voltage or current output as microbes break down material | Bioenergy and wastewater research; connects biology with measurable electricity |
| How String Tension and Length Affect Musical Pitch | Beginner–intermediate; 1–2 weeks | String, board, weights, tuner or frequency app | Measure how string length and tension change pitch | Acoustics and music; demonstrates clear mathematical relationships |
| Comparing Low-Cost Water Filtration Methods | Beginner; 1–2 weeks | Bottles, sand, gravel, charcoal, cloth, test water | Compare changes in turbidity or color across filter designs | Water science and public health; low-cost, clear before-and-after results |
| Testing Household Products for Antibacterial Effectiveness | Intermediate; 1–3 weeks | Agar plates, approved safe cultures, test products, protective gear | Compare inhibition zones or colony counts | Microbiology and hygiene; visible results, but requires strict safety supervision |
| Does Video Game Play Improve Reaction Time? | Beginner–intermediate; 2–4 weeks | Games, reaction-time test, participants, timer or software | Compare reaction times across gaming conditions or groups | Psychology and human performance; engaging with minimal equipment |
| Building an Image Classifier with Google’s Teachable Machine | Beginner–intermediate; 1–3 weeks | Computer, browser, labeled training examples | Test classification accuracy on new images, sounds, or poses | Artificial intelligence education; accessible, with opportunities to examine data bias |
| Paper Airplane Aerodynamics: Design Versus Flight Distance | Beginner; 1–2 weeks | Paper, measuring tape, optional launcher | Compare flight distance or hang time across designs | Aerodynamics and engineering; inexpensive, visual, and easy to repeat |
| Overall Comparison | Projects range from beginner to intermediate; typically 1–6 weeks | Mostly inexpensive materials; some require digital tools or lab supplies | Outcomes range from physical measurements to prototype performance and model accuracy | Suitable for varied science-fair interests, from biology and sustainability to physics, psychology, and AI |
Turn a Project Idea Into a Fair-Ready Experiment
The best science fair topic matches the student’s interests, resources, and available time without sacrificing careful testing. A project using household materials can be as meaningful as one involving a digital model or school laboratory when the question is focused and the method is clear. Students shouldn’t choose an idea just because it sounds advanced. They should choose one they can explain and test responsibly.
Start with one measurable question, then decide which variable to change and what result to record. Keep other relevant conditions steady, establish a control when the design calls for one, and plan repeated trials before building the display. A project log should note dates, materials, measurements, unexpected results, and any changes to the method. Brookhaven National Laboratory’s judging rubric emphasizes a logical process, dated records, and conclusions tied to collected evidence, making those habits useful well beyond a fair (science-fair judging criteria).
Resource limits don’t rule out a strong investigation. Students can work with common materials, school equipment, public datasets, or observations in their community. Teachers can help adapt a project when transportation, internet access, language, disability, safety, or specialist mentoring creates a barrier. The key is to make the method fit the student’s situation while keeping the evidence honest.
A polished display doesn’t need to claim that a result applies everywhere. It should show what the student tested, what the evidence supports, what remains uncertain, and what they’d investigate next. Negative or inconsistent results can still teach the student something when they’re recorded and explained rather than hidden.
Teachers and students planning age-appropriate classroom activities can also explore this guide to kindergarten science planning. For further research and approachable science and technology writing, maxijournal.com offers educational articles alongside coverage of health, business, arts, and other subjects. Use the project as a starting point for asking a better question, not as a script to copy. When students own the question and understand the method, they’re better prepared to explain both their findings and their limitations.
Explore maxijournal.com for approachable writing across science, technology, education, health, arts, and more. Students and educators can use its articles to spark research questions, build context for a science fair project, or discover fresh topics to investigate.
Discover more from Maxi Journal
Subscribe to get the latest posts sent to your email.